
An appropriately completed bowtie contributes to risk situational awareness, which in turn facilitates good risk management practices and efficient use of safety resources.
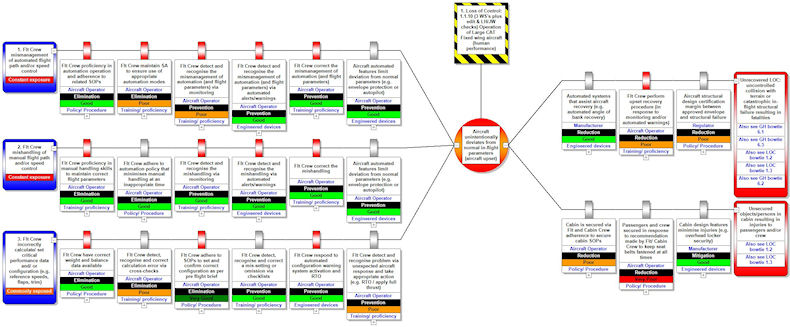
- The bowtie diagram displays areas of concern very clearly via the use of colours to highlight specific issues.
- A typical example is where a control has been assessed as critical (red), has an effectiveness rating of poor (orange) or very poor (red) and is present on a constant threat exposure (red).
The reader of the bowtie can immediately identify where the problem areas are and intuitively understand their role in the overall management of the hazard.
The image below is an example of how this colour coding is displayed.
Provide feedback for this page