
Analysis of flight tracks and profiles from radar data
Where required, CAA analyses local airport radar data to ensure the appropriate level of modelling accuracy. Extensive in-house radar analysis tools are used to generate mean flight tracks and the associated lateral dispersions for each route, and average flight profiles of height, speed and thrust for different aircraft types.
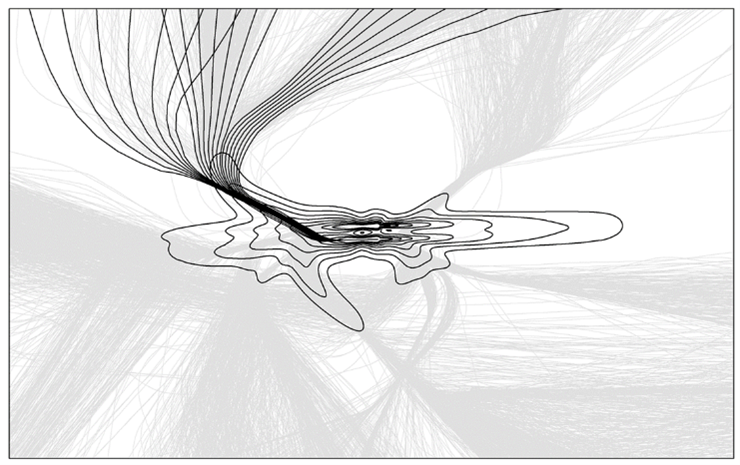
The diagram below shows a typical representation of a departure route at Heathrow using mean and dispersed tracks, together with the underlying radar data.
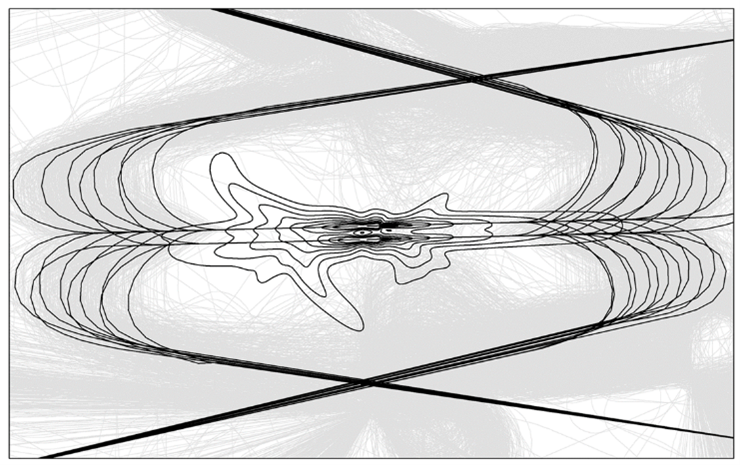
A typical representation of arrivals at Heathrow using multiple ‘spur’ tracks is shown below:
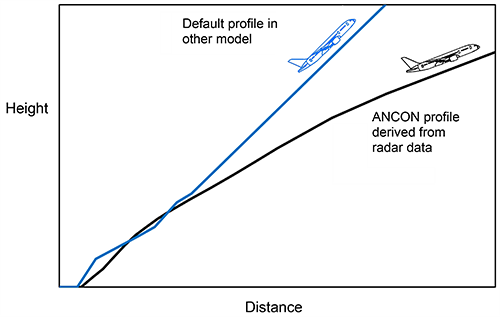
For some airports it is necessary to determine flight profiles for the noise dominant types at an airport using local radar data, since they may differ significantly from the ‘default’ profiles supplied in some noise models. For example, the following diagram shows the difference between the average departure height profile for the Boeing 787 as measured at the London airports, and a 'default' profile contained within another noise model.
Noise database verification
ANCON’s noise database is checked and updated on an annual basis by taking several hundreds of thousands of noise measurements around Heathrow, Gatwick and Stansted airports each year. The noise database contains data for specific airframe/engine combinations in the form of 'noise-power-distance' (NPD) curves, thus it is applicable to any airport. In particular, the database contains extensive noise information for the majority of aircraft types that operate from UK airports, unlike other noise models.
Terrain modelling
ERCD is able to include the effects of terrain in the noise modelling process for any UK airport. Ordnance Survey’s OS Terrain 50 data are used to make corrections for the distance between the aircraft noise source and ground receiver position. Locations that are higher than the runway level will be closer to the noise source and thus experience higher noise levels, and vice versa.
Terrain can have a significant effect on the shape and size of contours, especially where an airport is located in close proximity to hills or valleys.
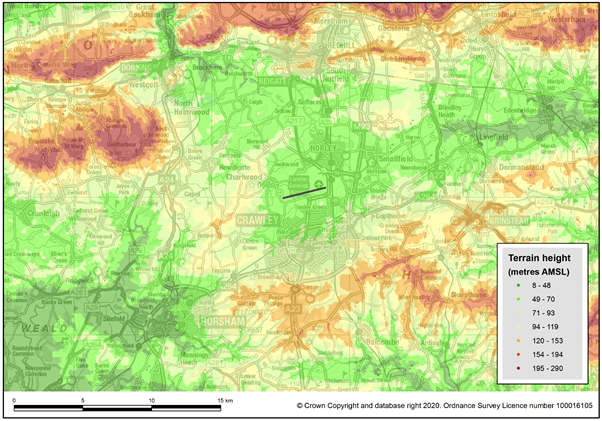
The diagram below illustrates the terrain surrounding an airport runway, colour coded by ground height (areas of high ground are shown in green).
Population database
We can estimate the areas, populations and number of households enclosed within each contour level using our population database, which is based on the latest UK Census (2021) and updated annually in the light of new data.
The population and households data are referenced to individual postcodes (shown as the square dots on the diagram below).
Noise sensitive buildings database
We are also able to determine the numbers of noise sensitive buildings (e.g. schools and hospitals) within a particular noise contour, as well as providing detailed information such as the name and address of each building.
Provide page feedback
Please enter your comments below, or use our usual service contacts if a specific matter requires an answer.
Fields marked with an asterisk (*) are required.